


Most Recent Articles
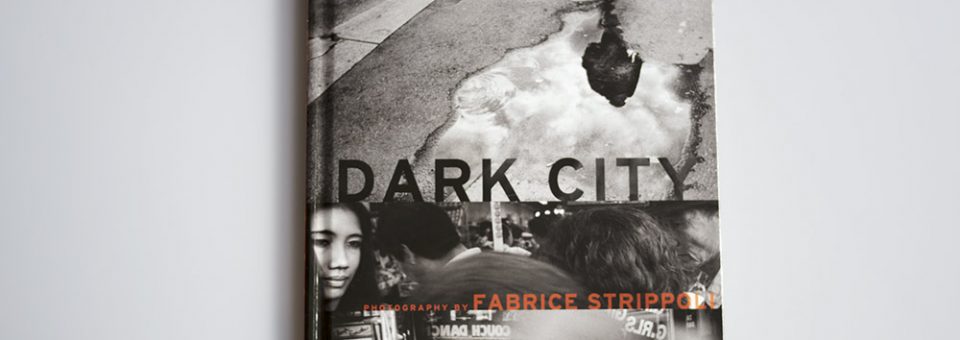
Dark City goes to Phoenix
From August 23 to September 28, 2014 at the Phoenix Art Museum in Arizona, Dark City is a part of the show INFOCUS: Juried Exhibition of Self-Published...
Read Moremodernism extends from a classical style
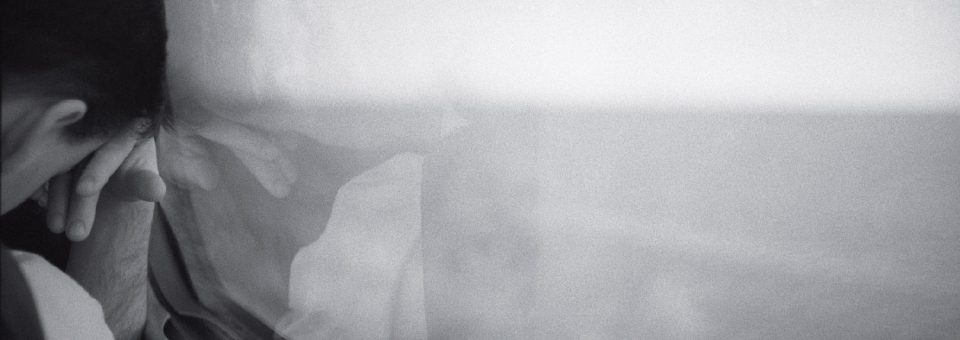
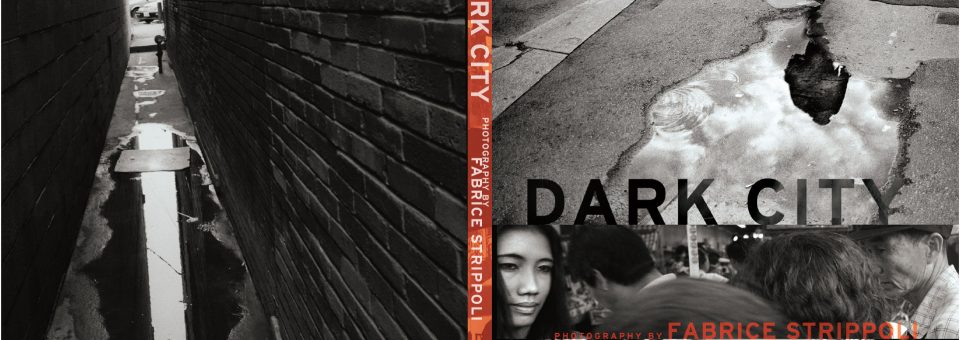
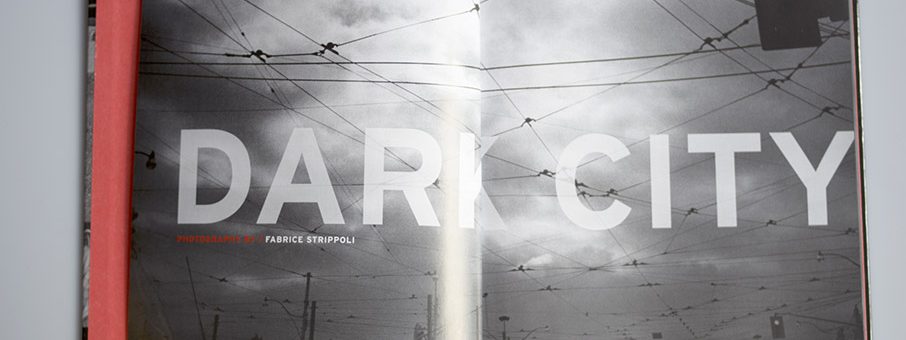
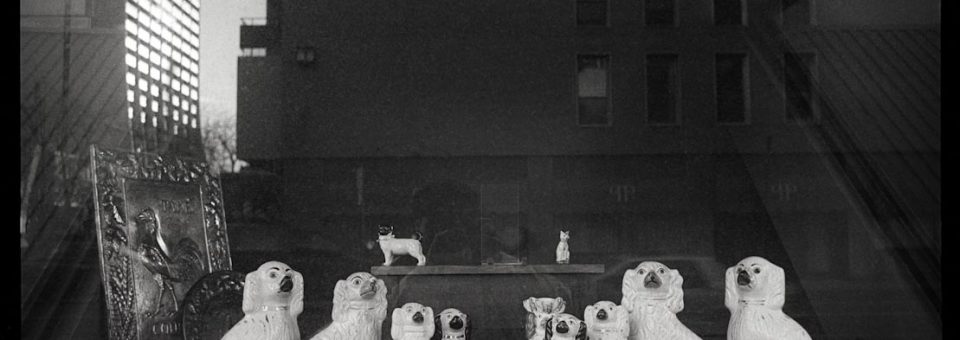
Dark City has just been delivered! Modern black and white street photography with roots firmly planted in the history of the classical style. Fabrice Strippoli explores human nature and space while discovering...
Read More